find me on...
youtube
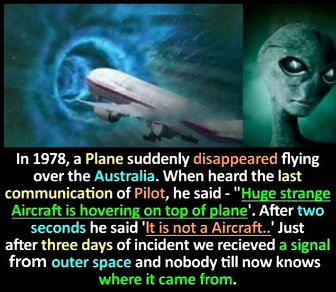
In 1978, a Plane suddenly disappeared flying over the Australia. When heard the last communication of Pilot, he said - "Huge strange Aircraft is hovering on top of plane'. After two seconds he said 'It is not a Aircraft..' Just after three days of incident we recieved a signal from outer space and nobody till now knows where it came from. ...read more
Ancient Aliens S6E4 - Magic of the Gods
Ancient astronaut theorists discuss magic, Merlin, and extraterrestrials.
bitchute ...read more
Ancient astronaut theorists discuss magic, Merlin, and extraterrestrials.
bitchute ...read more

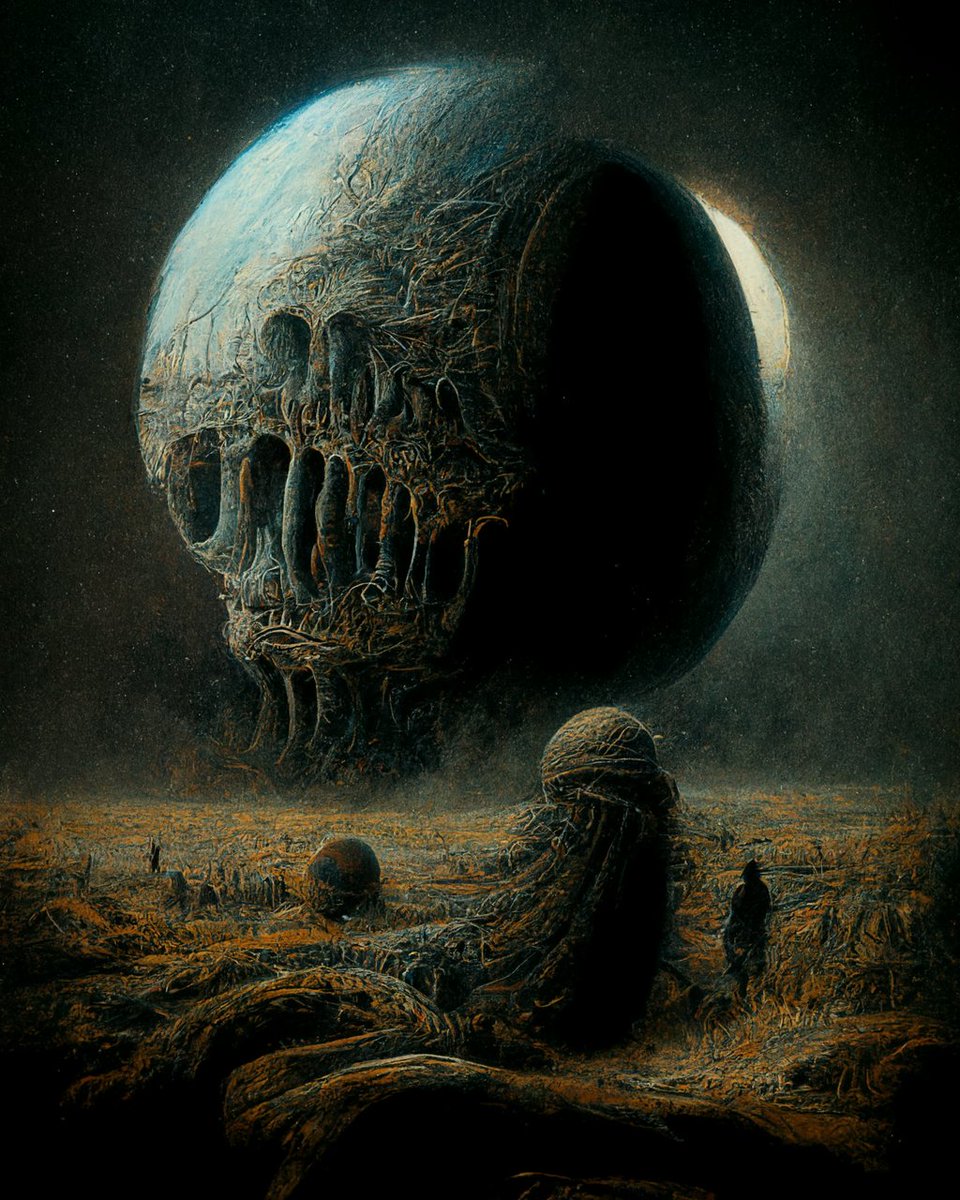
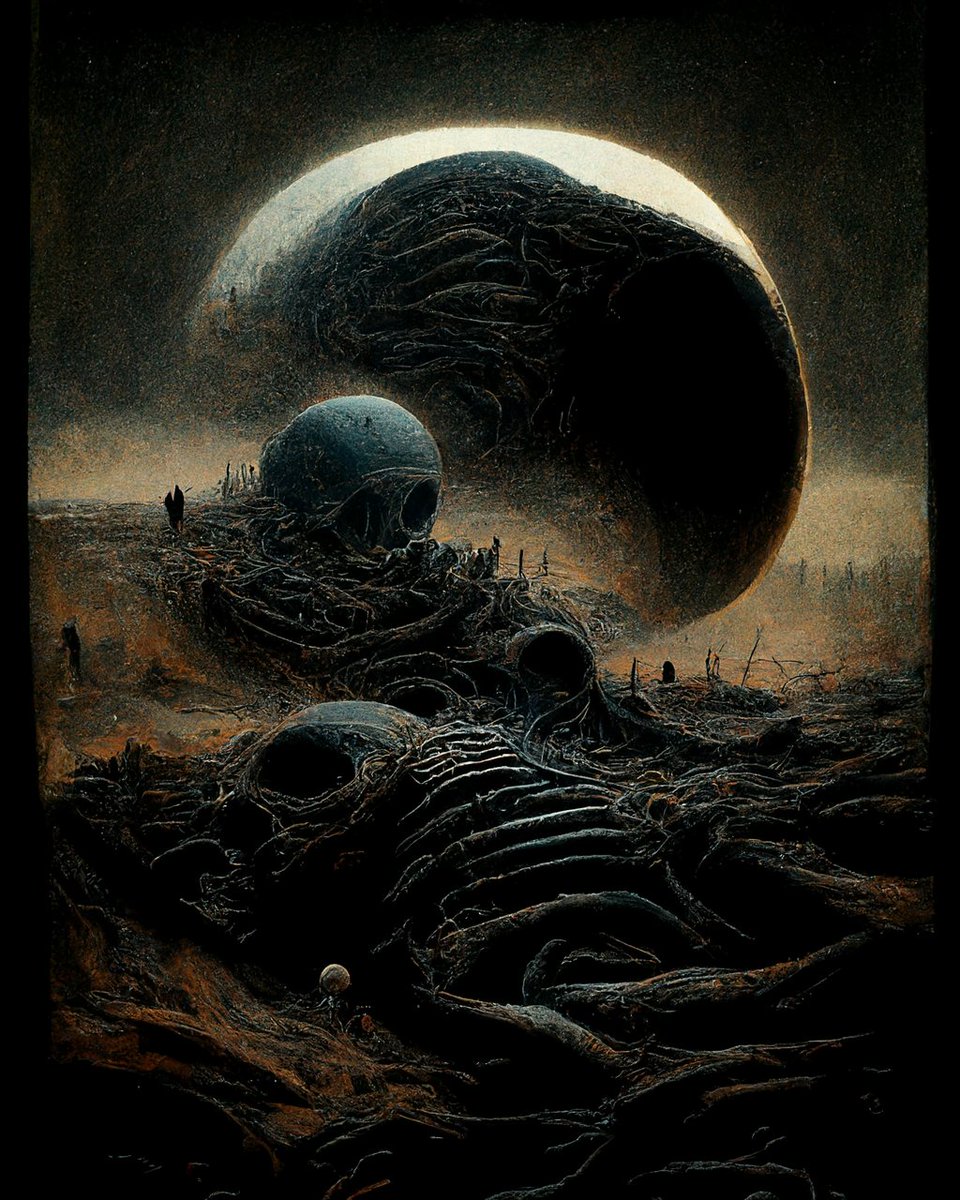
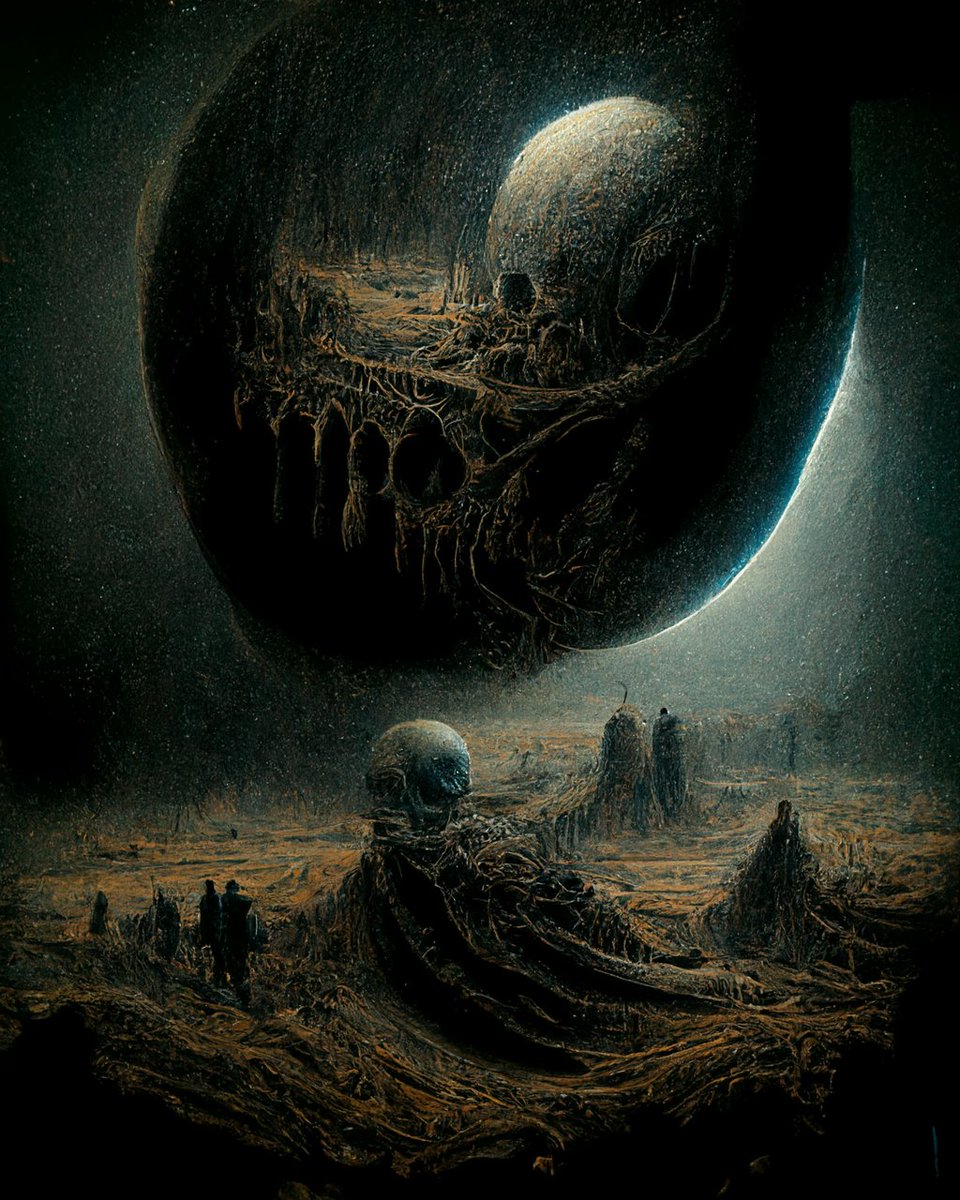
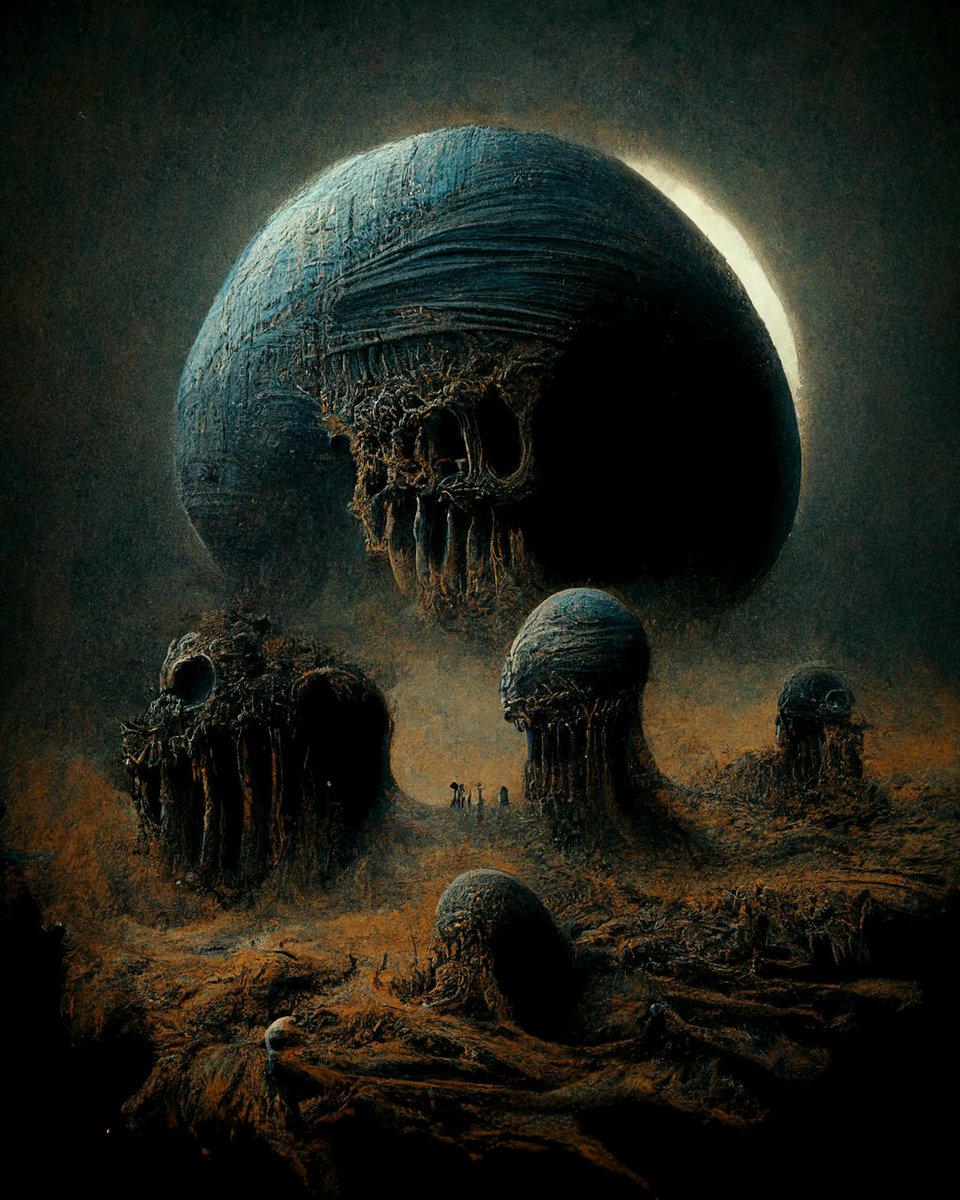
No telescope could observe the Dead Constelation, yet Tom would visit it every night in his dreams. Was it even a part of the same cosmos? He didn't know.
All he could be sure of was that year after year Earth would feel less like home.
#horrorprompt
#cosmichorror
#lovecraft
...read more
Ancient Aliens S01E04 - Closer Encounters
This episode suggests that alien encounters have been documented in various historical texts, citing as evidence, the 13th-century book Otia Imperialia which describes an incident in Bristol, England ascribed to UFOs; the log entries of Christopher Columbus that report lights in the sky; stories of cigar-shaped craft allegedly seen over Europe during the Black Plague; and Medieval art that supposedly depicts disc-shaped objects floating in the heavens.
bitchute ...read more